2020 was a turning point for e-commerce trends and predicted future growth.
The following stats and data will tell you more about the impact of COVID-19 on global e-commerce, changing online buying habits, international sales, e-commerce advertising, worldwide shipping, and much more.
If you were
still doubting it, here are some key statistics, that will help you understand
just how crucial it is to understand digital marketing and use e-commerce sales
to grow your business.
1. By the year 2040, it’s
estimated that 95% of all purchases will be through e-commerce. (Nasdaq)
2. The total number of websites in the
world is constantly changing, but we are getting closer to 2 billion. (Internet Live Stats)
Are you
wondering how many e-commerce companies are there globally? We were
asking the same question. We tried figuring out how many of the websites out
there are actually involved in the e-commerce ecosystem.
That’s not
an easy question to answer. If you Google it, you’ll probably come around the
following information:
3. There are between 12 million – 24
million e-commerce sites globally, with Less than 1 million of them selling
more than $1,000 per year. (99firms, KommandoTech, leading to DigitalCommerce360)
But this
information is based on an old research by DigitalCommerce360 from 2014.
Another
source provides an educated explanation why there are only 2 to 3 million
e-commerce companies in the world (excluding China). (PipeCandy)
Anyway,
this is a tough one to answer because the number keeps growing daily. Shopify alone have over 1 million merchants using
their platform, and you can check the number of live stores at BuiltWith. You got the picture…
So, to stay
in front of the curve, let’s take a look at some important e-commerce facts and
stats.
In this
list, we’ve rounded up some amazing e-commerce statistics you must know,
especially as a small and medium-sized business owner for 2021.
General E-commerce Statistics You Must Know in 2023
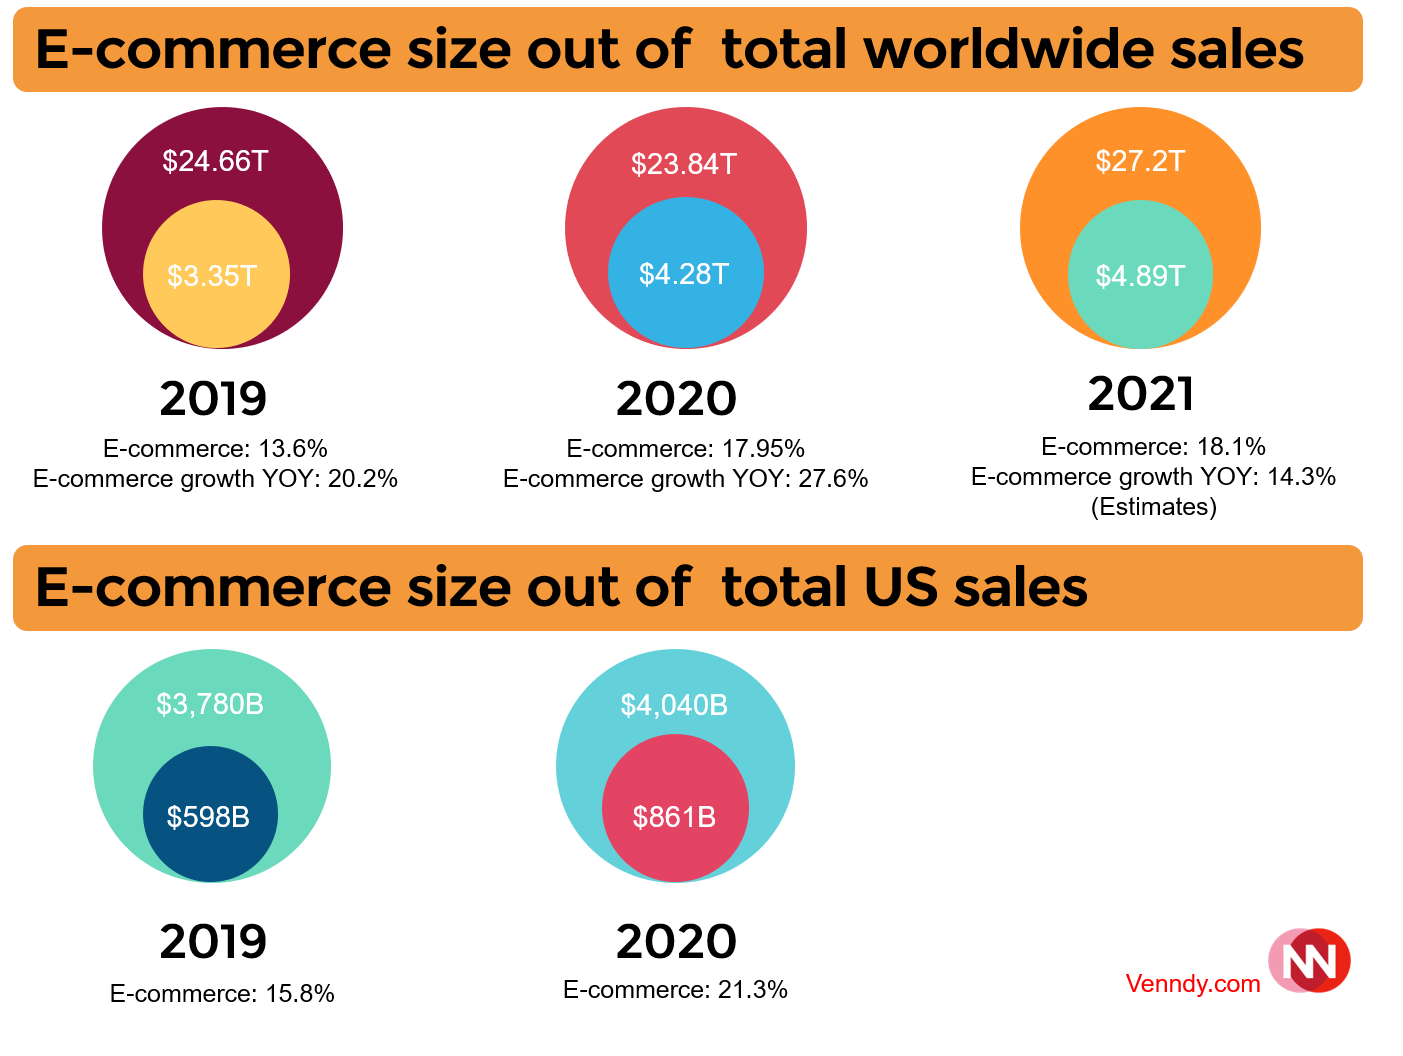
4. In 2020 worldwide retail e-commerce sales
grew 27.6% for the year, for a total of $4.280 trillion. (eMarketer)
5. E-commerce sales accounted for
almost 18% of total worldwide retail sales in 2020 which declined by 3.0%, to
$23.839 trillion. (eMarketer)
6. In 2021 worldwidee-commerceis anticipated to approach $5 trillion and is anticipated to represent 14.3% of total
retail sales. (eMarketer)

Sources: eMarketer-2019, eMarketer-2020, eMarketer-2021, eMarketer, DigitalCommerce360
7. In 2021, over 2.14 billion people
worldwide are expected to buy goods and services online. (Statista)
8. 22% is e-commerce share of total
global retail sales 2023. (Statista)
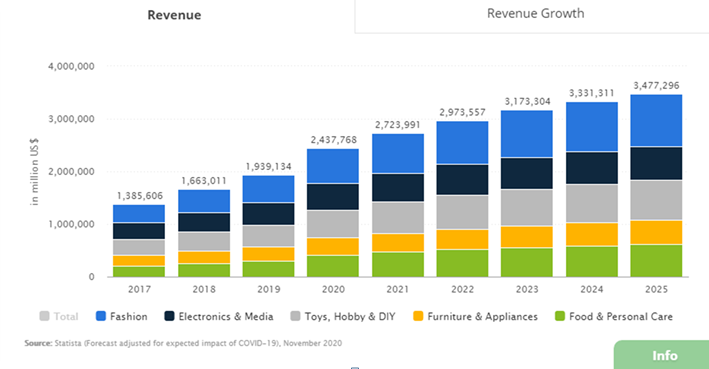
9. Revenue
in the e-commerce market is projected to reach US$2.7T in 2021. (Statista)
10. Revenue
is expected to show an annual growth rate (CAGR 2021-2025) of 6.3%, resulting
in a projected market volume of US$3.5T by 2025. (Statista)
11. User
penetration will be 50.8% in 2021 and is expected to hit 63.1% by 2025. (Statista)
12. The
average revenue per user (ARPU) is expected to amount to US$714.11. (Statista)
13. The
latest survey and studies in 2020 show that the average conversion rate of
e-commerce websites is 2.86%. The average eCommerce website conversion rate in
the US stands at 2.63% as compared to the global website conversion rate of
4.31%. (Invesp)
14. The #1 reason people shop online is
that they’re able to shop at all hours of the day. (KPMG)
E-commerce numbers usually do not include: digitally distributed services (eServices), digital media downloads or streams, digitally distributed goods in B2B markets nor digital purchase or resale of used, defective or repaired goods (re-commerce and C2C).

Social Commerce Statistics
Social
commerce is defined by eMarketer as everything including products or
services ordered by buying directly on a social platform, or through clicking
links on the social network that lead to the retailer’s product page with an
immediate purchase option.
Social
commerce is a fast-growing segment of the US e-commerce market that’s garnering
more attention and investment from media companies and brands.
In 2020,social
commerce accelerated in the US amid the pandemic-driven e-commerce boom as key
platforms advanced their shopping and checkout capabilities. (eMarketer)
15. China is the most advanced social
commerce market in the world with sales accounting for 13.1% ($363.26 billion) of
total e-commerce sales in 2021. (eMarketer)
16. US social commerce will reach $36.09
billion—less than one-tenth that of China—while accounting for 4.3% of US e-commerce
sales in 2021. (eMarketer)
17. 74% of consumers rely on their
social networks to make purchasing decisions. (Awario)
18. Social media posts with 80 characters or less get 66% more engagement. (Neil Patel)
Your brand
can see a huge boost in profits if you include social media in your digital
marketing strategy. And it’s one of the very best ways to use the powerful
psychological phenomenon of social proof to make more money online and grow
your business.

Facebook E-commerce Statistics
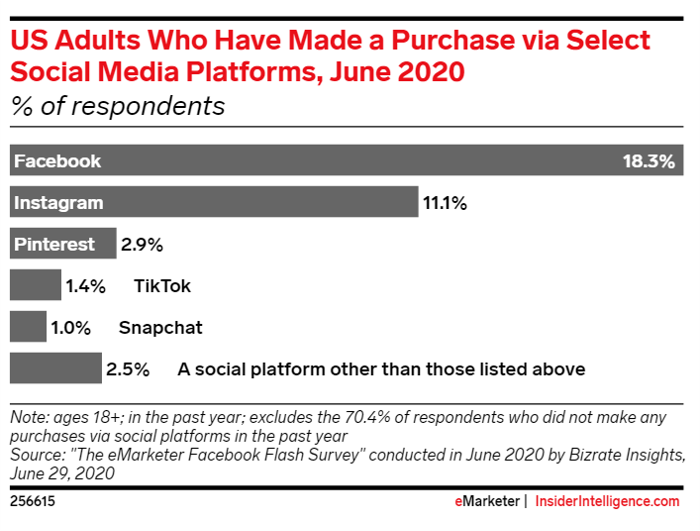
19. 18.3% of U.S. adults made a purchase
through Facebook in the last year. Compare that to 11.1% for Instagram and 2.9%
for Pinterest. (eMarketer)
20. 35% of consumers surveyed say
Facebook is an important factor in deciding which retailers to patronize. (Shopify)
21. Worldwide ad spending on Facebook
and Instagram combined will reach nearly $95 billion in 2021. (eMarketer)
22. An average Facebook user clicks on
12 ads per month. (Hootsuite)
23. Posts with photos on Facebook get 53% more Likes, 104% more comments, and 84% higher click-through rates. (Neil Patel)

Instagram E-commerce Statistics
24. 90% of Instagram users follow a
business. (Business Instagram)
25. 200 million
Instagram users visit at least one business profile daily. (Facebook for Businesses)
26. 81% of people use
Instagram to help research products and services. (Business Instagram)
27. 130
million Instagram users tap on shopping posts every month. (Business Instagram)
28. 50% of people have visited a website
to make a purchase after seeing a product or service in Stories. (Business Instagram)
29. Brand Stories have an 86% completion
rate. (Conviva)
30. 55% of fashion shoppers have made a
purchase based on an Instagram creator’s post. (Creators)
31. 67% of brands use Instagram for
influencer marketing. (Influencer Marketing Hub)

Pinterest E-commerce Statistics
32. Shopping
is a top priority for 48% of Pinterest users. (eMarketer)
33. 85% of Pinners put visuals first
when shopping for apparel and furniture. (Pinterest)
34. The average revenue earned per U.S.
user (ARPU) went up 26% to $4 in 2019 is significantly higher than international
users, who average a spend of $0.21. (Pinterest letter to Shareholders)
35. Pins that show a product or service
in action are 67% more likely to drive sales. (Pinterest report)

YouTube E-commerce Statistics
36. The
number of channels earning six figures each year on YouTube has increased by
40% year on year. (YouTube Press)
37. "How to” are growing 70 percent year
over year. (SearchEngineLand)
38. Consumers are 64-85% more likely to
buy a product after viewing a product video. (BigCommerce)
39. 62% of businesses use YouTube as a
channel to post video content. (Buffer)
40. 9% of all small businesses in the US
use YouTube. (Brandwatch)
41. 90% of people say they discover new
brands or products on YouTube. (Think with Google).

Small Businesses (SMBs) E-commerce Statistics
42. 68% of small businesses don’t have a
structured or documented conversion rate optimization (CRO) strategy. (State of Conversion Optimization
Report)
43. The e-commerce industry is growing
23% year-over-year, yet 46% of American small businesses still don’t have a
website. (BigCommerce)
44. Shoppable social media features will help
independent retailers achieve convenience and reliability (Shopify for Yotpo).

45. 61% of online consumers in the
United States have made a purchase based on recommendations from a blog. (Content Marketing Institute)
46. Content creates three times more
leads than ads and costs 62% less. (Awin,BloggingX)
47. Content marketing has improved
revenues for affiliate marketers by 240%. (TrueList)
48. 80% of brands say they've increased the amount of content
they produce.(Influencer Marketing Hub)

Influencers Marketing E-commerce Statistics
49. Top three goals of influencer marketing are increasing brand awareness
(85%), reaching new audiences (71%), and generating sales / conversions (64%). (MediaKix)
50. The majority of brands (59%) have a
standalone budget for content marketing, and 75% of them intend to dedicate a
budget to influencer marketing in 2021.(Influencer Marketing Hub-IMH)
51. 90% of our survey respondents
believe influencer marketing to be an effective form of marketing.(IMH)
52. 36% of brands still tend to pay their influencers with free product
samples (or even just discounts on more expensive products) rather than paying
cash to their influencers. (IMH)
53. 38.5% of brands view influencer marketing success based on conversions
and sales.(IMH)
54. 67% of brands use Instagram for influencer marketing. (IMH)
55. The percentage of brands using TikTok for influencer marketing continues
to increase. (IMH)
56. 67% of respondents prefer their influencer marketing to be
campaign-based rather than always-on. (IMH)
57. Micro-influencers on Instagram
boast an average engagement rate of 3.86%. This declines for every level of
influencer before hitting 1.21% for mega-influencers.(IMH)
58. 61% of marketers agree that
it’s difficult to find the right influencers for a campaign. (MediaKix)
If you are new to affiliate marketing, tohelp you along, we have created a free "Affiliate Marketing Strategy Cheat Sheet” according to which you can build your "Affiliate Marketing StrategyMap.”
GRAB OUR FREE AFFILIATE MARKETING STRATEGY CHEAT SHEET AND BUILD YOUR AFFILIATE MARKETING STRATEGY MAP

Affiliate Marketing E-commerce Statistics
59. 81% of brands use an affiliate
program to promote their products or services. (Rakuten)
60. Affiliate marketing generates 16% of
all e-commerce sales in the US and Canada. (Business Insider)
61. 94% of publishers use multiple
affiliate marketing networks. (Affise)
62. 40% of online marketers consider
affiliate marketing a crucial skill. (BloggingX)
63. 64.48% of affiliate marketers
generate traffic by blogging. (Awin,BloggingX)
64. 9% of affiliate marketers make over
$50,000 annually. (VigLink)

Marketplaces E-commerce Statistics
An online
marketplace is a type of e-commerce site where products or services are
provided by multiple third-party vendors, whereas transactions are processed by
the marketplace operator.
65. In 2018, the biggest online
marketplace based on gross merchandise volume was Chinese platform Taobao with
a GMV of 515 billion U.S. dollars. (Statista)
66. Tmall and Amazon ranked second and
third with 432 and 344 billion U.S. dollars in annual third-party GMV
respectively. (Statista)
67. Amazon maintained its spot as the
No. 1 online retailer in North America, with revenues of over $296 billion in
2020. (DigitalCommerce360)
68. Sales on Amazon alone represented
nearly a third—31.4%—of all U.S. e-commerce sales growth in 2020, down from
43.8% share in 2019. (DigitalCommerce360)
69. The top 100 retailers (minus
Amazon) had a 74.1% share of e-commerce growth in 2020, up significantly from a
49.4% share in 2019. (DigitalCommerce360)
70. In 2020, however, it’s clear that
the pandemic pushed many more consumers online—and they didn’t all shop on
Amazon. At least some are shopping on other large online retail sites, such as
Walmart, Best Buy, Target and more. For the list of 10 leading marketplaces in
the US, check out DigitalCommerce360.
71. The leading reasons for purchasing at a marketplace instead of a
retailer are: more competitive prices, free shipping, wider range of product
categories, product reviews, and speed of delivery. (Statista)
72. Lastly, most shoppers don’t realize
that they’re shopping in a marketplace. When people are buying products online
from Best Buy or Home Depot, they think they’re buying products directly from
these brands, but they’re actually shopping in a marketplace and receiving
goods from another company. (Yotpo)


You can choose to comment as a guest.